Farmers
Insurance
Insurance and Financial Services
Gain visibility into critical business drivers, track key performance indicators (KPIs) from diverse data sources, and monitor customer engagement across various platforms.

Project
Details
Scope of Work . Data Integration, Healthcare Analytics, Mobile Application Development
Farmers Insurance Group, commonly known as Farmers, is a prominent insurer group in the United States. They offer a wide range of insurance products, including coverage for automobiles, homes, small businesses, as well as other insurance and financial services.
Obstacles
Farmers Insurance encountered several critical challenges in their quest to enhance data visibility and decision-making.

Data Integration
They needed to gain visibility into the factors driving their core business but struggled to consolidate data from various sources.

KPI Tracking
Tracking key performance indicators (KPIs) was challenging due to data coming in from multiple sources, causing inefficiencies.

Customer Engagement Monitoring
Farmers aimed to track customer engagement and usage across web, mobile, and API-based applications to improve customer experiences.

Executive Insights
Executives sought a centralized platform to provide engagement insights, enabling data-driven decision-making.
Solution Approaches
GFGG IT partnered with Farmers Insurance to address these challenges.
The following solution approaches were implemented:

Data Integration
Data from internal data warehouses (DW), Salesforce Event Log files, and other CSV sources were merged to create a unified dataset.
KPI Visualization
GFGG IT introduced the ‘Likelihood to Recommend’ KPI to view trends across customer segments and lines of business.
Customer Engagement Dashboard
The ‘Login Dashboard’ was created to monitor customer engagement across multiple platforms, segments, and devices.
The following solution approaches were implemented:
Data Integration
Data from internal data warehouses (DW), Salesforce Event Log files, and other CSV sources were merged to create a unified dataset.
KPI Visualization
GFGG IT introduced the ‘Likelihood to Recommend’ KPI to view trends across customer segments and lines of business.
Customer Engagement Dashboard
The ‘Login Dashboard’ was created to monitor customer engagement across multiple platforms, segments, and devices.
The following solution approaches were implemented:
Data Integration
Data from internal data warehouses (DW), Salesforce Event Log files, and other CSV sources were merged to create a unified dataset.
KPI Visualization
GFGG IT introduced the ‘Likelihood to Recommend’ KPI to view trends across customer segments and lines of business.
Customer Engagement Dashboard
The ‘Login Dashboard’ was created to monitor customer engagement across multiple platforms, segments, and devices.
Final Results
01
Insightful Data Exploration
Users could efficiently explore data, discover trends, and answer questions about why these trends were occurring, enhancing decision-making.
02
Unified Customer Insights
Core login data could now be married to user policy data, providing valuable insights into customer behavior.
03
Seamless Quote Access
Users gained the ability to drill down to the quote in Salesforce (SFDC), whether on desktop or mobile devices, improving accessibility and analysis.
Related Case
Studies
In our case study section, we showcase real-world success stories, demonstrating how our tailored solutions have driven tangible results for our clients. Explore these success stories to see how GFGG IT can transform your business through the power of technology.
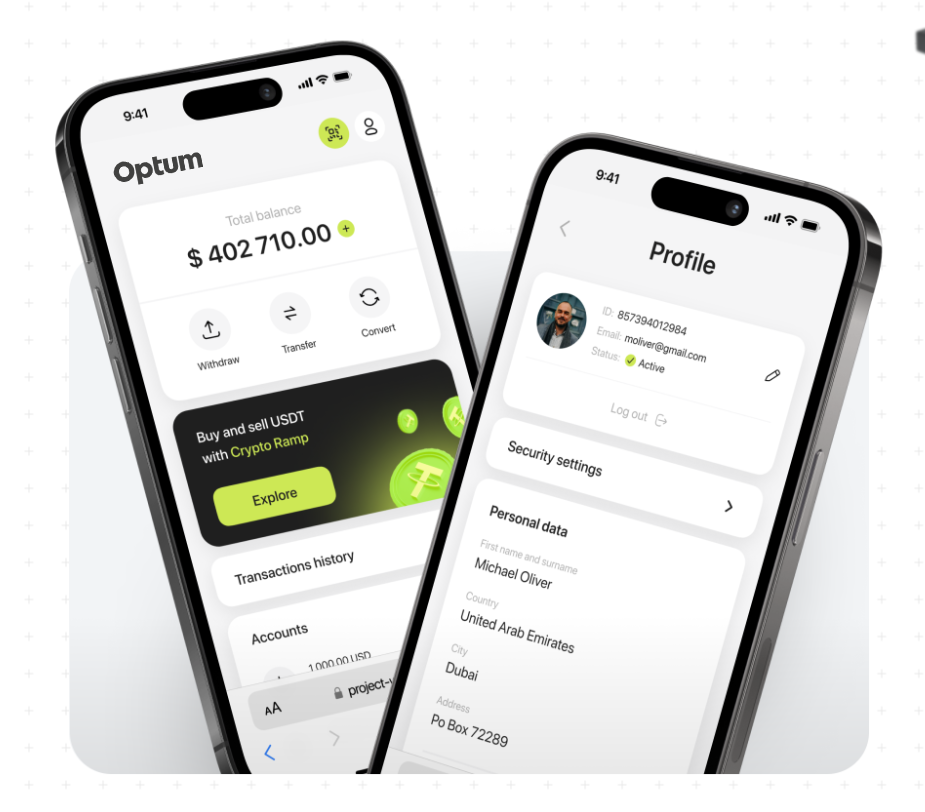
Optum
Financial Services
Address data silos, streamline data visualization,
simplify BI schema changes, and provide
an easy-to-use analytics platform for healthcare data.

20%
Faster User Adoption
70%
Improved Data Analysis
85%
Enhanced Flexibility
Optum2
Financial Services
Address data silos, streamline data visualization,
simplify BI schema changes, and provide
an easy-to-use analytics platform for healthcare data.
20%
Faster User Adoption
70%
Improved Data Analysis
85%
Enhanced Flexibility
Optum3
Financial Services
Address data silos, streamline data visualization,
simplify BI schema changes, and provide
an easy-to-use analytics platform for healthcare data.
20%
Faster User Adoption
70%
Improved Data Analysis
85%
Enhanced Flexibility
Optum4
Financial Services
Address data silos, streamline data visualization,
simplify BI schema changes, and provide
an easy-to-use analytics platform for healthcare data.
20%
Faster User Adoption
70%
Improved Data Analysis
85%
Enhanced Flexibility
Let’s highlight your values to your customers. But first, let’s get familiar with each other.
We're now taking on new projects for the upcoming months. Schedule a call with us to explore how we can work together to bring your vision to life.
